Why do weather models sometimes give such different forecasts?
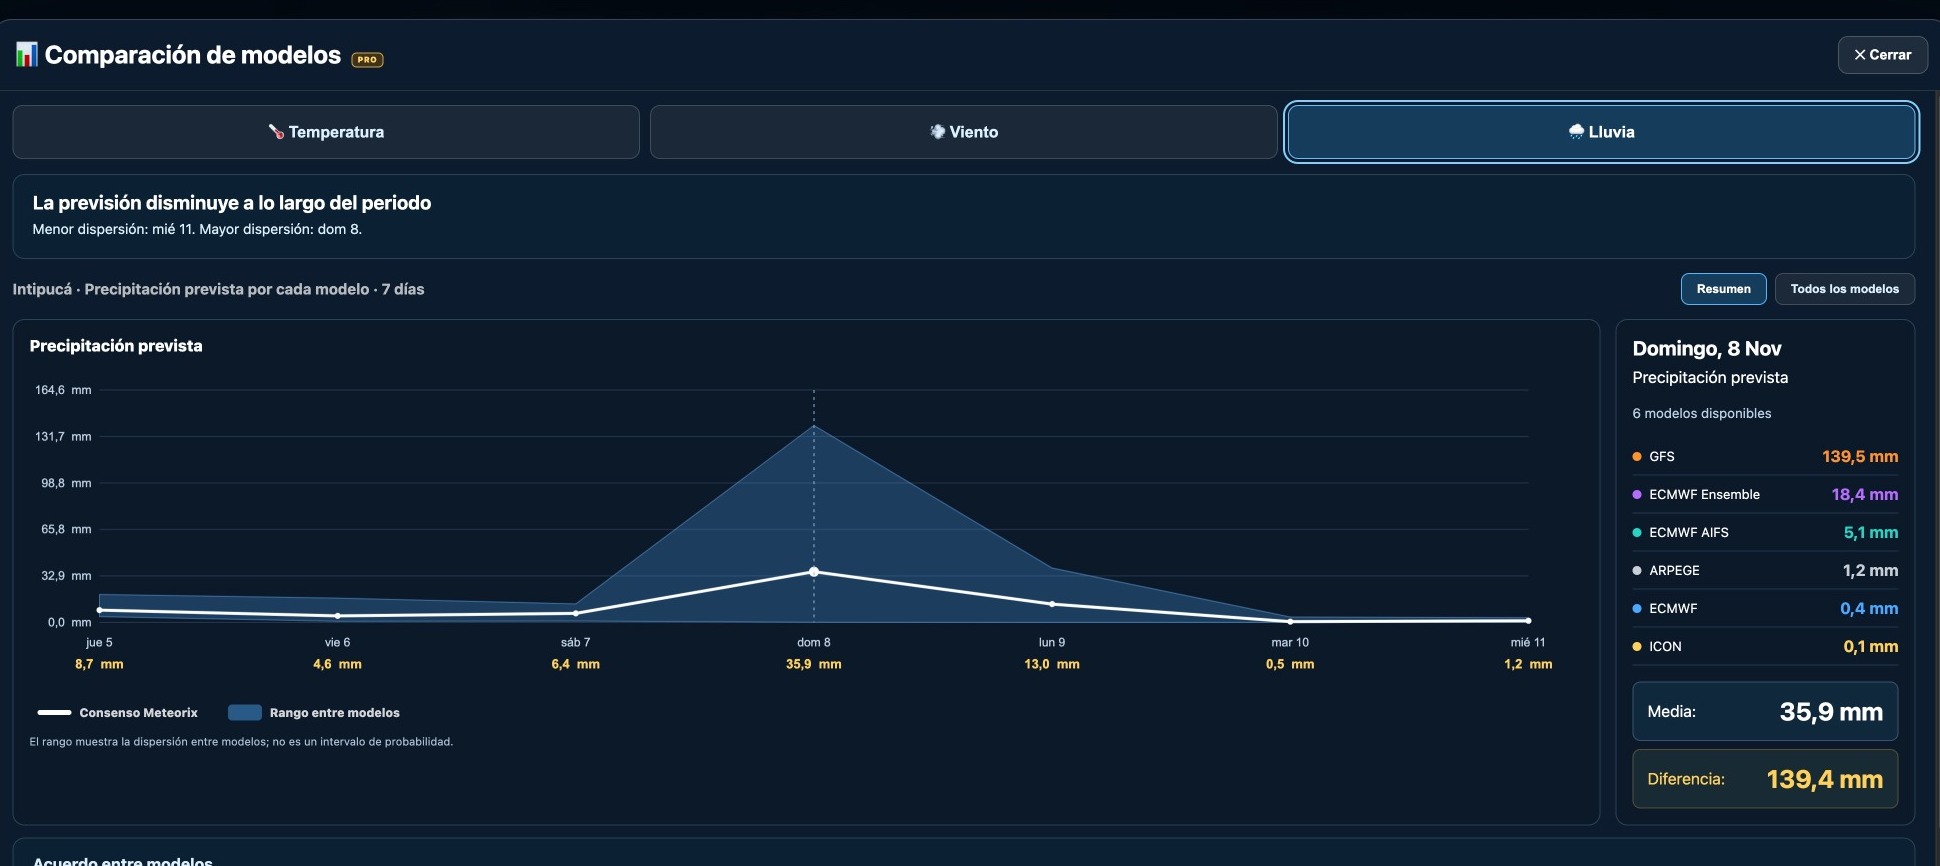
One model forecasts torrential rain while another expects barely a shower in the same location. How can they disagree so sharply? A Meteorix comparison for Intipucá, El Salvador, captured on 5 November 2026, shows why no model can predict the atmosphere perfectly.
✦ Meteorix editorial team◷ 8 min readWeather guide
Meteorix model comparison captured on 5 November 2026 for Intipucá. Forecast for 8 November; not observed rainfall.
Intipucá: a striking difference between forecasts
On 5 November 2026, Meteorix displayed sharply different rainfall forecasts for Sunday 8 November in Intipucá, eastern El Salvador. These were forecasts made before that date, not observed rainfall.
Model or product
Forecast rainfall
GFS (United States)
139.5 mm
ECMWF Ensemble
18.4 mm
ECMWF AIFS
5.1 mm
ARPEGE (France)
1.2 mm
ECMWF IFS
0.4 mm
ICON (Germany)
0.1 mm
The highest and lowest forecasts differed by 139.4 mm. Such a gap signals very different possibilities for the same location.
1. Models do not start from an identical atmosphere
A forecast begins with an estimate of current temperature, moisture, pressure and wind across the globe. Satellites, weather stations, radiosondes and aircraft provide observations, but the complete atmosphere cannot be measured perfectly.
Each centre combines observations using its own data-assimilation methods. Small initial differences can amplify over time in the chaotic atmosphere, an idea often described as the butterfly effect.
2. Resolution affects where storms are placed
Numerical models divide the atmosphere into three-dimensional grid cells. A thunderstorm can be smaller than a cell in a global model. One forecast may place the heaviest rain over Intipucá while another shifts it 30 kilometres away.
In Central America, tropical moisture, mountains and nearby oceans can create large rainfall contrasts across short distances. Finer resolution helps represent some details but does not guarantee accuracy.
3. Models describe clouds and rainfall differently
Cloud formation, raindrop growth, ice processes and thunderstorm updrafts involve physics too complex or too small for every global grid cell to resolve. Models represent these processes through parameterisations, which differ between forecasting systems.
Machine-learning systems such as ECMWF AIFS follow a different approach from conventional physics-based models. Different methods and initial conditions can produce contrasting rainfall totals.
4. Local rainfall is especially difficult to predict
An intense storm may produce very heavy rain in a narrow area while nearby places stay relatively dry. Forecasting the exact location and timing is harder than predicting broad regional temperatures.
Daily totals can also diverge if one model places the storms late on Sunday and another early on Monday. Always compare the same accumulation window and forecast definition.
5. Does this mean the GFS was wrong?
Not necessarily. The GFS suggested a far wetter scenario than the other displayed products. Its forecast does not prove 139.5 mm would fall, but an outlier should not automatically be dismissed.
Check whether subsequent GFS runs maintain the heavy-rain scenario.
Watch whether other models begin to converge or continue to disagree.
Explore ensemble forecasts for alternative outcomes.
Compare with observations and official warnings when available.
6. Does model consensus solve the problem?
Comparing models helps avoid relying on just one prediction. Agreement often supports greater relative confidence, while large disagreements highlight uncertainty.
But averages can hide incompatible scenarios. If five models predict little rain and one predicts an extreme amount, the mean may suggest a middle outcome none actually forecasts. ECMWF Ensemble is also a probabilistic ensemble product, not directly equivalent to a deterministic model run.
How to compare forecasts on Meteorix
Search for a location on Meteorix and open the Models comparison (PRO).
Select Rain, Wind or Temperature and review the available models.
Choose the same day and compare individual values and the model range.
Check accumulation periods and revisit the forecasts after new model runs.
Meteorix helps identify uncertainty; it does not automatically identify which forecast will verify. Use model evolution, observations and official weather warnings together.
Conclusion: uncertainty is useful weather information
Weather models are powerful but cannot reproduce the atmosphere perfectly. Their differences help indicate when a forecast is relatively robust and when several outcomes deserve consideration.
The Intipucá example shows why a good forecast should explain not just what weather is expected, but how confident we can be in the prediction.
EXPLORE THE MAP
Accumulated rainfall and model comparison on Meteorix
Compare ECMWF, GFS and ICON for the same place and forecast period. Search for Intipucá on Meteorix and open the Models comparison (PRO). Forecasts change as new model runs become available.
No model is consistently best for every variable, region or forecast lead time. Accuracy depends on the situation and verification against observations.
Does the GFS extreme forecast mean that much rain will fall?
No. It is a scenario worth monitoring, not a guarantee.
What does disagreement between models tell us?
It signals uncertainty, not necessarily dry weather.
Is the spread between models a probability interval?
No. A model range is not automatically a calibrated probability interval.